Rutuparna Rout • January 29, 2026
Top 22 spend management KPIs to optimize procurement in 2026

Rutuparna RoutContent Writer
Last update: January 12, 2026
8 min read

Today’s business world has moved from just ‘buying’ to ‘managing spend’ strategically. Research shows that companies lose 5 to15% of their total spend through outdated procurement methods, while high performers can manage up to 85% of their spend. This is where spend management KPIs are indispensable, as they provide clear visibility into spending patterns, compliance, and savings opportunities. By using KPIs to track key metrics such as maverick spending, contractual savings, and supplier performance, and implementing platforms like Procol, organizations can identify risks that need to be mitigated, avoid unnecessary costs, and enhance their relationships with suppliers.
What are spend management KPIs?
Spend management KPIs are metrics used to track, control, and optimize an organization’s spending. These include key indicators such as spend under management, which reflects the share of total spend under procurement governance; cost Savings, which measures the financial impact of sourcing and efficiency initiatives; and maverick Spend, which highlights purchases made outside approved policies.

What are the benefits of using spend management KPIs?
The use of spend management key performance indicators enables organizations to measure modern procurement outcomes, benchmark productivity, and maintain fiscal discipline. The indicators will not only reveal where money is being spent but also provide actionable steps to deliver savings, manage suppliers, and maintain compliance. Here are six advantages of implementing KPIs for spend management:
1. Improved cost control
KPIs help organizations identify cost leakage, waste, and over-expenditures. Tracking savings recognized, maverick/outside spend, and spend under management empowers an organization to negotiate better contracts and reduce overall procurement costs.
2. Better visibility
They provide organizations with clear visibility into how budgets are allocated across categories, departments, and suppliers, while also enabling leaders to make better-informed decisions and verify that budgets are spent effectively and in line with deliverable timelines.
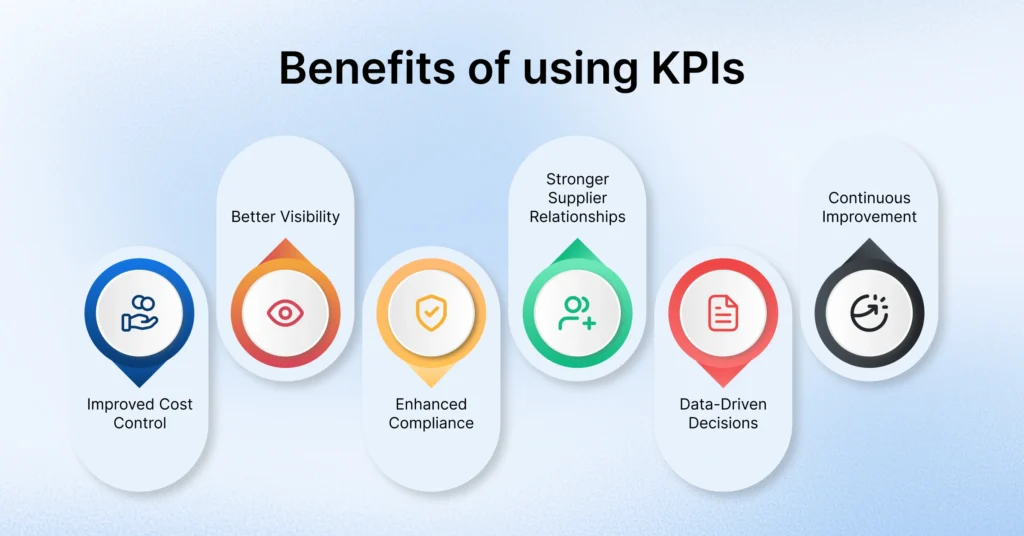
3. Enhanced compliance
Managing KPIs, such as supplier compliance rate and contract adherence, enables the organization to verify that employees and suppliers procure goods and services in accordance with approved procurement KPIs and policies. This enables organizations to minimize instances of maverick or off-contract spending actions and more effectively manage governance overall.
4. Stronger supplier relationships
KPIs enable organizations to measure supplier performance against specific metrics, including delivery schedules, price stability, and service quality. The data gives organizations the information to strengthen working relationships with trusted suppliers and to respond to non-compliant or underperforming suppliers.
5. Data-driven decisions
When leaders have trusted spend analysis data, they can make decisions about procurement policies and procedures based on reality rather than on conceited assumptions. They will also enhance their negotiating skills, optimize their category spend, and align their purchasing practices with broader, long-term business objectives.
6. Continuous improvement
When leaders monitor and analyze spending, they can identify trends, establish performance benchmarks, and pinpoint areas for process improvements. Ongoing monitoring helps create an environment of continuous improvement within the procurement function.
Top 22 spend management KPIs to track in 2026
Aside from monitoring costs, procurement groups now need to prepare themselves to deploy intelligent solutions so they can become obvious and in control of their procurement data. These spend management KPIs help to track savings, compliance, supplier performance, and risk while aligning with organizational objectives. Tracking these KPIs to gain visibility ultimately enables a procurement group to remain competitive and future-ready.
1. Savings
This is relatively easy and may even be obvious, so you select it first. To determine the effectiveness of your tactics, identify the year-over-year percentage of real savings. If you are comparing yourself and do not have a year of data, it is fine to look at monthly savings. Just don’t forget to consider seasonality and any unique factors specific to your industry.
Calculation: Year-over-Year Savings % = (Previous Year Spend – Current Year Spend) / Previous Year Spend) × 100
2. Cost reduction
Savings and cost reduction are not the same thing. While cost savings explore opportunities to lower product and system price points, cost reduction seeks to eliminate unnecessary costs by removing services and products. Identify current savings you made by discounting services and products, when compared to historical expenses.
Calculation: Cost Reduction = Historical Expenses – Current Expenses After Eliminations
3. Price avoidance
Price avoidance is an important KPI for manufacturing, trade, life science, and medical companies. This KPI determines the amount of money you saved by avoiding unintentional re-placements, repairs, or damages. Think about the amount of savings generated by proper monitoring of materials (which eliminated the disposal of old supplies), taking care of tools (which avoided expensive failure), or inventory management (which avoided excess inventory and hasty ordering).
Calculation: Price Avoidance = Cost of Potential Damages/Replacements – Actual Costs Incurred
4. Total spend under management
Total spend under management likely refers to the portion of your company’s spending that is consistently managed by your procurement system. For total cost objectives, consider the total addressable spend and then apply it to the spend under management KPI objectives.
Calculation: Spend Under Management % = (Managed Spend / Total Company Spend) × 100
5. Maverick spends
Maverick spending is the most significant risk to a good strategy for many procurement software groups, as it circumvents the contract management system your group worked so hard to purchase and implement. A recent study found that over 54% of employees admit to making purchases without the required authorization mechanisms.
Calculation: Maverick Spend % = (Unauthorized Spend / Total Spend) × 100
6. Overall spending contribution
Contribution to total spending means understanding where your spending is going, whether it is on specific items, category types, or vendors. Setting KPIs to track those contributions is essential because it helps you identify savings opportunities. Two examples might be setting up a new contract management system with a high-volume vendor or funneling frequent commodity spending to a single vendor to leverage your buying power.
Calculation: Category Contribution % = (Category Spend / Total Spend) × 100
7. Agreement pricing & agreement compliance
Agreement compliance is crucial for the performance of an e-procurement company. Set a KPI to ensure that contract management system pricing is consistently honored on both the supplier’s and buyer’s sides. The supplier must offer you an agreed price, and it is just as critical for buyers across your business to do so.
Calculation: Contract Compliance % = (Compliant Purchases / Total Contract Purchases) × 100
8. Purchase price variance (PPV)
Set a KPI to monitor and manage price volatility. PPV is the difference between the expected costs you plan to spend and the actual price of the products when you purchase them. Volatility may arise from outdated pricing information, vendor changes, rush orders, incorrect quantity estimates, or other inaccurate projections. By reducing the PPV, you can spend more precisely and plan your budget more effectively.
Calculation: PPV = (Actual Price – Expected Price) / Expected Price) × 100
9. Supplier administration
Supplier administration is an important area to examine, and there are many metrics that you can use. Consider establishing a metric to monitor the percentage of your spend that flows through a given set of suppliers.
Calculation: Supplier Spend % = (Individual Supplier Spend / Total Spend) × 100
10. Supplier efficiency
Supplier performance, another key vendor administration KPI, involves monitoring a supplier’s reliability and consistency. This metric should include suppliers’ pricing, quality, delivery, and customer service performance. These procurement KPIs can help identify weaknesses in your distribution network, enabling you to find better sourcing alternatives.
Calculation: Supplier Performance Score = Weighted Average of (Pricing + Quality + Delivery + Service Scores)
11. Supplier risk score
Evaluates suppliers based on their financial stability, regulatory compliance, delivery reliability, and ESG factors. This KPI helps mitigate risks and maintain supply chain continuity.
Calculation: Risk Score = Σ(Risk Category Weight × Category Score)
12. On-time payment rate
Monitors the percentage of invoices for which suppliers receive payment within the agreed-upon timeliness. Promptly paying invoices strengthens trust and fosters a collaborative culture with suppliers, and helps you secure discounts when suppliers offer early-payment discounts.
Calculation: On-Time Payment % = (Invoices Paid On Time / Total Invoices) × 100
13. Total cost of ownership
Considers more than just the purchase price, including maintenance, operation, and disposal costs. This holistic approach enables more informed procurement decisions.
Calculation: TCO = Purchase Price + Maintenance + Operation + Disposal Costs
14. ROI on procurement technology
Measures the value and savings associated with what’s been spent on procurement technology solutions and platforms. A high ROI indicates that digital solutions are generating value.
Calculation: Procurement Tech ROI % = ((Savings from Technology – Technology Cost) / Technology Cost) × 100
15. Sustainable/green spend
Percentage of spend with ethical, eco-friendly, or sustainable suppliers. This KPI demonstrates ESG commitment and strengthens brand reputation. By tracking these KPIs from spend under management to supplier compliance and sustainability, businesses make smarter, data-driven decisions. Combining efficiency, cost-saving, and risk metrics positions organizations to stay competitive, agile, and future-ready.
Calculation: Green Spend % = (Sustainable Supplier Spend / Total Spend) × 100
16. Invoice Processing Time
Measures days from invoice receipt to payment completion. Shorter times strengthen supplier relationships and capture early payment discounts, automate workflows to reduce processing delays and administrative costs.
Calculation: Average Processing Days = Total Processing Days / Number of Invoices
17. Purchase Order Accuracy Rate
Tracks the percentage of purchase orders issued correctly without changes. Calculate by dividing accurate orders by total orders. Low accuracy causes delays and extra costs. Use standardized templates to improve results.
Calculation: PO Accuracy % = (Accurate POs / Total POs) × 100
18. Budget Variance
Measures the difference between planned and actual spending. Calculate by subtracting actual from budgeted spend, then divide by the budget. Significant variances indicate poor forecasting or weak controls. Monitor monthly for timely adjustments.
Calculation: Budget Variance % = ((Actual Spend – Budgeted Spend) / Budgeted Spend) × 100
19. Contract Renewal Rate
Shows the percentage of supplier contracts renewed at expiration. High rates indicate strong relationships but may signal insufficient market evaluation. Balance supplier loyalty with exploring new opportunities for better value.
Calculation: Renewal Rate % = (Renewed Contracts / Expiring Contracts) × 100
20. Spend Concentration Risk
Measures dependency on single suppliers. Track the percentage going to top suppliers. Best practice, no supplier should exceed 20-30% of total spend. High concentration creates vulnerability; diversify to protect operations.
Calculation : Concentration Risk % = (Top Supplier(s) Spend / Total Spend) × 100
21. Time to Contract
Tracks days from supplier selection to executed agreement. Long timelines delay projects and increase costs. Standardize contract templates and streamline approvals to accelerate the process.
Calculation: Average Days = Total Days from Selection to Signature / Number of Contracts
22. Emergency Purchase Rate
Percentage of purchases made urgently, bypassing procedures. Emergency buying costs more due to premium pricing and lost negotiation power. High rates signal poor planning, and improve forecasting and inventory management.
Calculation: Emergency Purchase % = (Emergency Purchases / Total Purchases) × 100
Maximize your procurement KPIs’ effectiveness with Procol
Procol empowers organizations to track procurement KPIs with precision, optimize spend, and strengthen supplier relationships. With the right platform, teams can go beyond basic KPI measurement and adopt best-in-class spend analysis tools and practices. Procol enables you to analyze data effortlessly, uncover trends, and take corrective actions in real time. For organizations looking to enhance efficiency, improve visibility, and make smarter decisions, this platform makes a difference.
The following points highlight how Procol helps organizations improve all aspects of their procurement KPIs.
1. KPI-driven spend analysis positions organizations to stay ahead of competitors and achieve long-term procurement excellence.
2. Centralized spend data gives procurement teams a single source of truth, eliminating silos and improving visibility.
3. Intuitive user interface dashboards and analytics make it easy to track KPIs like spend under management, maverick spend, supplier compliance, cost savings, and more.
4. Automation and AI insights replace manual reporting, enabling faster, data-driven decision-making.
5. Improved compliance and reduced risk help organizations achieve sustainable cost savings.
6. Seamless workflows strengthen collaboration and engagement with suppliers.
Conclusion
In 2026, organizations must track procurement KPIs to control costs, reduce risks, and strengthen supplier relationships. Metrics like spend under management, maverick spend, supplier compliance, and invoice accuracy offer valuable insights, but only when paired with effective spend-analysis practices. Procol provides a single platform for viewing spend data, analyzing in real time, improving reporting, and collaborating with suppliers. Together, strong KPI tracking and Procol help organizations boost procurement performance and achieve sustainable value.

Frequently asked questions
Why are spend management KPIs important?
These KPIs provide visibility into spending patterns, highlight areas for savings, improve supplier relationships, and ensure compliance with procurement policies. They enable organizations to make data-driven decisions and reduce operational risks.
What are the 4 KPIs every manager has to use?
The four most commonly used KPIs for managers are:
- Revenue Growth – tracks how much sales are increasing over time.
- Profit Margin – measures how much profit the company keeps after expenses.
- Customer Satisfaction – shows how happy and loyal customers are.
- Employee Productivity – evaluates how effectively employees contribute to results.
How to measure spend under management?
Spend under management is measured by dividing the total spend controlled through approved procurement policies, systems, and contracts by the organization’s total spend.
What are the 4 P's of KPI?
The 4 P’s of KPI are:
- Purpose – why the KPI is being measured.
- Performance – what result is being tracked.
- Process – how the KPI will be measured and monitored.
- Progress – how the KPI helps in achieving long-term goals.
What is a KPI in budgeting?
A KPI in budgeting is a metric used to track how well an organization sticks to its financial plan. It measures whether actual spending and revenues align with the planned budget. Common budgeting KPIs include budget variance, cost per unit, and return on investment.
How often should you review spend management KPIs?
It is recommended to review KPIs monthly to track progress, identify anomalies early, and adjust spending policies before they significantly impact budgets.
How can you improve KPI reporting?
Automated systems can significantly improve accuracy by eliminating manual data entry, capturing transactions in real-time, and ensuring consistent reporting. Using a unified platform that integrates expense and accounting systems can address data silos and improve reporting.
Schedule a Demo
We’d love to hear from you. Please give us a call on +1 315-645-2799.
Explore more from Procol
Discover expert tips, how-to guides, industry insights, and the latest procurement trends.

Procurement orchestration: All you need to know in 2026
Explore the value of procurement orchestration, how it works, its benefits,...

What is supplier diversity and why is it important?
In the modern corporate competitive world, where both market resilience and...

Top 10 accounts payable automation software in 2026: ratings & features
Managing accounts payable manually might seem simple when your business is...