


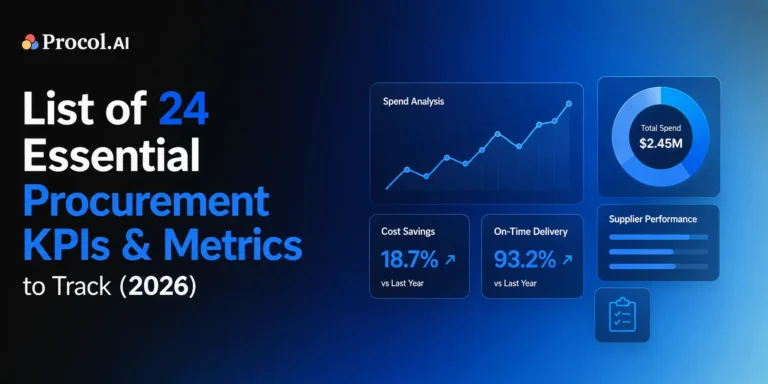
List of 24 Essential Procurement KPIs & Metrics to Track (2026)

Last update: September 7, 2026
Most procurement teams don’t have a data problem. They have a signal problem. The dashboards exist. Somebody pulls the numbers every month. And yet savings targets get hit while supplier issues quietly multiply, or approval times creep from one day to three without anyone raising it—because nobody was watching that particular number. That’s what procurement KPIs are for. Not just for measurement, but to warn early. Procurement workloads are up by 8% through 2026. Headcount isn’t. And the gap between the companies losing 5–15% of spend to outdated processes and the high performers keeping 85% under management comes down almost entirely to what gets watched.
Key Takeaways
What are procurement KPIs?
Procurement key performance indicators (KPIs) are quantifiable metrics that help teams measure the efficiency, value, and overall performance of the procurement function across five core areas: cost and savings, spend management, supplier performance, process efficiency, and compliance and risk.
The terms shift depending on who’s asking. Purchasing key performance indicators usually refers to the same set viewed from a narrower angle — order accuracy, PO cycle time, on-time delivery, the metrics a buying team owns day to day. Procurement KPIs cover that plus the strategic layer: supplier risk, savings realization, spend under management.
Whatever you call them, the commonly tracked ones are spend under management, cost savings, procurement cycle time, on-time delivery rate, contract compliance rate, and procurement ROI. Together they give a far more accurate picture than optimizing any single metric.

Why do procurement KPIs matter?
Procurement problems rarely announce themselves. They accumulate.
A dependable supplier starts slipping — a day late, then three, then a week. Orders begin going outside contracted rates. An approval that took a day now takes four, and nobody can say when that changed. Each looks trivial alone. Together they erode negotiated savings and produce delays that land on someone else’s desk as a production problem.
Good purchasing KPIs catch that drift early: keeping spending on track, flagging supplier and contract issues, locating where buying stalls, showing whether decisions move results.
Procurement KPIs at a glance
| # | KPI | Category | Formula | Review |
| 1 | Cost savings | Cost | (Baseline − Negotiated Price) × Volume | Quarterly |
| 2 | Cost avoidance | Cost | (Quoted − Negotiated Price) × Volume | Quarterly |
| 3 | Savings realization rate | Cost | (Realized ÷ Projected Savings) × 100 | Quarterly |
| 4 | Purchase price variance | Cost | (Actual − Standard Unit Price) × Quantity | Monthly |
| 5 | Procurement ROI | Cost | [(Benefits − Costs) ÷ Costs] × 100 | Annually |
| 6 | Spend under management | Spend | (Managed Spend ÷ Total Spend) × 100 | Quarterly |
| 7 | Spend under contract | Spend | (Contracted Spend ÷ Total Spend) × 100 | Quarterly |
| 8 | Maverick spend | Spend | [(Total − Approved-Channel Spend) ÷ Total] × 100 | Monthly |
| 9 | Spend concentration risk | Spend | (Top Supplier Spend ÷ Total Spend) × 100 | Quarterly |
| 10 | Budget compliance rate | Spend | (In-Budget Spend ÷ Total Spend) × 100 | Monthly |
| 11 | Spend-to-revenue ratio | Spend | (Procurement Spend ÷ Revenue) × 100 | Annually |
| 12 | On-time delivery rate | Supplier | (On-Time Deliveries ÷ Total Deliveries) × 100 | Monthly |
| 13 | Supplier lead time | Supplier | Avg (Goods Received Date − PO Date), days | Monthly |
| 14 | Supplier defect rate | Supplier | (Defective Units ÷ Total Units) × 100 | Monthly |
| 15 | Supplier risk score | Supplier | Σ (Risk Factor Score × Weight) | Quarterly |
| 16 | On-time payment rate | Supplier | (Invoices Paid On Time ÷ Total Invoices) × 100 | Monthly |
| 17 | Procurement cycle time | Process | Avg (PO Date − Requisition Date), days | Monthly |
| 18 | Purchase order cycle time | Process | Avg (PO Dispatch − Approval Date), days | Weekly |
| 19 | Procure-to-pay cycle time | Process | Avg (Payment − Requisition Date), days | Monthly |
| 20 | Invoice processing time | Process | Avg (Approval − Receipt Date), days | Monthly |
| 21 | Cost per invoice | Process | Total AP Costs ÷ Invoices Processed | Quarterly |
| 22 | Order accuracy | Process | (Error-Free POs ÷ Total POs) × 100 | Monthly |
| 23 | Contract compliance rate | Compliance | (Compliant ÷ Total Transactions) × 100 | Quarterly |
| 24 | Emergency purchase rate | Compliance | (Emergency ÷ Total Purchases) × 100 | Monthly |
24 procurement KPI examples by category
Every procurement KPI answers a different question. Some measure costs, while others track suppliers, processes, compliance, or risk. Looking at these categories together gives a more comprehensive view of procurement performance.
Here are the 24 procurement KPIs to track:
1. Cost management KPIs
Easiest to report, easiest to compare — and easiest to misread. Cost-savings procurement metrics tell you whether the value you negotiated is real and durable.
- Cost savings — Money taken out of spend through sourcing, negotiation, or better terms. The most-watched number in procurement, and the one that flatters hardest. A team can post excellent savings in a quarter where quality slipped badly.
- Cost avoidance — Spend you prevented rather than removed. Blocking an announced increase, renegotiating early. It never hits the budget, which is why finance treats it with suspicion and procurement over-claims it. Set the baseline first.
- Savings realization rate — Negotiated savings and banked savings aren’t the same number. This is the gap. A team consistently landing 60% has a contract adoption problem, not a negotiation problem — harder bargaining won’t touch it.
- Purchase price variance (PPV) — What you planned to pay against what you paid. Here, positive is unfavorable; some organizations flip the sign. Either works, provided finance and procurement agree — a classic source of two teams reaching opposite conclusions from identical data.
- Procurement ROI — Value delivered against the cost of running the function. The cleanest answer to “what does procurement return” — and the number most likely requested the week before budget season.
2. Spend management KPIs
Spend visibility is where most organizations lose ground. The same commodity gets bought from four vendors at four prices. Spend analysis metrics make that visible.
- Spend under management (SUM) — The share of organizational spend procurement actually influences.
Track one metric from this list and make it this one. Every other number has a denominator problem when SUM is low — a 12% savings figure means something entirely different at 40% than at 85%. And low SUM isn’t underperformance. It means large parts of the business are buying without procurement in the room.
- Spend under contract — How much spend runs through negotiated agreements. High numbers mean the contracts your team fought for are being used.
- Maverick spend — Anything bought outside approved suppliers, contracts, or process. The mirror image of #7, and usually the number that surprises people most when first measured properly. The fix is almost never a stricter policy. It’s a faster intake path.
- Spend concentration risk — How much spend sits with your largest suppliers. Rule of thumb: no single supplier above 20–30% of total. Past that you carry dependency risk that stays invisible until the supplier has a problem.
- Budget compliance rate — How much spend stayed inside approved budgets. Improves forecast accuracy as much as cost control.
- Spend-to-revenue ratio — Procurement spend as a proportion of revenue. A board-level number showing whether the cost base scales with growth.
3. Supplier performance KPIs
Supplier performance degrades gradually. A delivery arrives late. Quality slips. Over two or three quarters that compounds into production delays traceable to a supplier nobody flagged.
- On-time delivery rate — How often suppliers actually deliver by the date they committed to. A simple metric that directly affects production planning, inventory levels, and every delivery promise your sales team has already made to a customer.
- Supplier lead time — Order to receipt, in days. Track by supplier and category — the portfolio average hides the two suppliers causing your planning headaches.
- Supplier defect rate — Received units that fail quality inspection. Rising rates point at a capability problem rather than a bad batch, and surface later as cost, delay, or complaint.
- Supplier risk score — A weighted composite: financial health, geographic concentration, compliance history, cyber posture, delivery record. A supplier can look healthy in review while carrying strain that surfaces two quarters later.
- On-time payment rate — Your side of the relationship. Paying on schedule builds goodwill you’ll want during a shortage and unlocks early-payment discounts. Chronic lateness quietly raises your prices.
4. Process efficiency KPIs
Most delays aren’t one bottleneck. They’re distributed — two days in approvals, three in PO generation, four in invoice matching. Nobody owns the total, so nobody fixes it.
- Procurement cycle time — Requisition raised to PO issued. The core measure of sourcing and approval speed across the procurement lifecycle.
- Purchase order cycle time — Requisition approved to PO dispatched. A subset of #17, and where a surprising amount of time disappears. Approval doesn’t mean the PO went out.
- Procure-to-pay cycle time — Requisition to supplier paid. The full procure-to-pay span, and the number suppliers experience — which makes it the one shaping your negotiating position.
- Invoice processing time — Invoice received to approved for payment. Shorter cycles mean fewer escalations and better discount capture.
- Cost per invoice — Fully loaded cost of processing one invoice. The cleanest test of whether AP automation pays for itself.
- Order accuracy — POs issued without errors in quantity, price, supplier, or delivery. Every wrong order becomes rework, and rework is invisible in most reporting.
5. Compliance and risk KPIs
Contract breaches, policy exceptions, and emergency purchases often leave a trail before they become audit findings. Tracking them gives procurement teams a chance to address problems earlier.
- Contract compliance rate — How consistently suppliers and your own teams stick to the pricing, service levels, and contractual terms everyone signed off on at the start. Negotiating a contract is the easy part. Making sure it’s honoured on both sides, month after month, is where the savings show up or quietly leak away. It’s a core metric for effective contract management.
- Emergency purchase rate — Unplanned, last-minute buying as a share of total. Some of it is unavoidable. A consistently high rate isn’t a procurement problem — it’s a forecasting problem showing up in procurement’s numbers.

Which procurement KPIs actually matter?
Twenty-four is a reference list. Not a dashboard.
For a monthly leadership review, five or six: spend under management, savings realization rate, procurement cycle time, on-time delivery rate, contract compliance, maverick spend.
For a board pack, three: procurement ROI, spend concentration risk, supplier risk score. A board doesn’t need cycle time. It needs to know what the function returns and what could break.
Everything else is diagnostic. The strongest procurement performance management programs review all five categories rather than optimizing one.
How agentic AI changes procurement measurement
Most KPI frameworks assume people do the work and software records it. That assumption is coming apart.
When AI agents run sourcing events and route approvals on their own, some metrics stop meaning much. Cycle time is the obvious case — if an agent closes an RFQ-to-award cycle in hours, the number just confirms the automation is on. Teams running autonomous sourcing find the question shifts from how long did that take to how much happened without us.
Three measures are getting more useful:
- Autonomous completion rate — transactions closed end to end with no human touch. The real maturity number, and what separates organizations running AI from those that bought it.
- Exception rate — how often an agent escalates. Falling rates mean well-calibrated guardrails; rising ones point to data or policy logic, not agent failure.
- Decision auditability — automated decisions carrying a human-readable record of how they were reached. In regulated industries, now a governance requirement.
Human throughput used to be a decent proxy for how much procurement got done. It isn’t anymore, and the gap keeps widening each year.
Common challenges in tracking procurement KPIs and how to overcome them
- Different teams define the same KPI differently
Procurement and finance routinely report different savings numbers for the same quarter. One counts what was negotiated; the other counts what reached the bottom line. Neither is wrong. They just never agreed on the definition.
What helps: Write the definitions and formulas down before the reporting cycle starts, not during the disagreement.
- Supplier problems surface too late
Late deliveries and slipping quality accumulate quietly. By the time either shows up in a quarterly review, operations have already absorbed the hit.
What helps: Review supplier metrics monthly and treat small movements as signals, not noise.
- Procurement data sits across too many systems
Spend lives in the ERP. Suppliers live somewhere else. Contracts, invoices, and POs are spread across three more tools. Most teams spend their reporting time assembling data rather than reading it.
What helps: Bring it into a single view. The analysis is the value; the assembly is overhead.
- Reporting doesn’t produce action
Dashboards are everywhere. Decisions changing because of them are not.
What helps: For every metric on the dashboard, name the decision it informs and the person who makes it. Anything left over comes off.
How Procol helps teams track procurement KPIs
Most procurement teams already know which metrics matter. The hard part is getting the data into one place before the deadline. Teams burn hours assembling before they can start reading.
Procol brings your procurement data into a single view, so reporting starts with analysis instead of assembly.
- See your spend properly: Track spend under management, contract compliance, and maverick spend without jumping between a dozen reports to answer a question finance asked twenty minutes ago.
- Catch supplier problems early: Delivery reliability, sourcing outcomes, and compliance history together. Issues surface while they’re still a data point, before they become a production call at 6 a.m.
- Find and address the bottlenecks that matter: Cycle times, approval delays, and PO performance — you can see where requisitions are stalling — and fix it while fixing it is still cheap.
- Everyone reports the same numbers: One source for every procurement and purchasing KPI. Procurement, finance, and business teams stop arguing about whose spreadsheet is right and start thinking about what to do.
Teams using Procol have cut PR-to-PO cycle time by up to 40%. Signature Global has already run over $72 million in procurement activity through the platform. For benchmark data on AI adoption, talent, and supplier resilience, see our State of Procurement report.
Frequently asked questions
What do the 5 P’s of procurement stand for?
The 5 P’s of Procurement are Price, Product, Place, People, and Process. These are the key areas to manage in procurement.
Which five KPIs are most commonly used to measure procurement performance?
The top five procurement KPIs are cost savings, supplier performance, procurement cycle time, contract compliance, and spend under management.
What KPIs are defined under the Procurement Act?
Under the Procurement Act, KPIs are measures used to measure supplier performance and whether they are abiding by and fulfilling the terms of the contract throughout the lifecycle.
What are the 3 P’s in procurement?
The 3 P’s in Procurement are People, Process, and Paperwork. These three elements are very important to ensure everything runs smoothly.
What do the 4 P’s of KPI represent?
The 4 P’s, often in KPI contexts, are Product, Price, Place, and Promotion.
What is a procurement KPI dashboard and how is it used?
A procurement KPI dashboard is a visual tool that shows managers and teams key performance indicators. This helps in monitoring how effective the procurement process is and whether operations are running smoothly.
Which KPIs should be tracked for purchasing activities?
The main purchasing KPIs that should be tracked are cost savings, supplier performance, and procurement cycle time to measure efficiency and value.
What tools can be used to measure procurement KPIs?
Today’s modern enterprises use procurement software to efficiently measure procurement KPIs. To measure procurement KPIs for your organization, you can use Procol’s end-to-end procurement platform, which displays key metrics on an easily navigable dashboard. Using this platform, you can easily access all KPIs and track procurement performance effectively.
What is an example of a KPI for procurement manager?
The primary example of this type of KPI would be cost savings. This measures the percentage of money saved in current procurement activities as compared to the previous year’s budget or total spending. This KPI tracks how efficiently the company allocates its budget and how well it is able to adhere to it.
How do you measure procurement performance?
Procurement performance is measured against a defined set of procurement performance metrics. Most teams track cost savings, purchase order cycle time, supplier defect rate, contract compliance, and spend under management. Pull the data from your source-to-pay system, baseline it, then trend it quarterly.
How frequently should KPIs related to procurement be reviewed?
Every procurement KPI serves a different purpose, which means each needs to be tended to differently. Some KPIs require monthly tending, even weekly if the volumes are high, like cycle time, PO accuracy, and invoice exceptions. Others, like savings realization, supplier risk, and category maturity, that fall under strategic procurement KPIs move slowly and are safe to be assessed quarterly. The whole scorecard can be reviewed once annually to ensure it still matches the business you’re actually running.
What is the difference between procurement KPIs and procurement metrics?
Procurement metrics are the raw measurements — number of POs raised, supplier count, average invoice value. Procurement key performance indicators are the handful you’ve tied to a target and a business outcome, with someone accountable for them. Metrics describe what happened. KPIs tell you whether you’re winning.
What are the KPIs for a purchasing department?
The KPIs for a purchasing department tend to fall into four buckets: cost, speed, quality, and compliance. Cost savings and cost avoidance. Purchase order cycle time and supplier lead time. Supplier defect rate and on-time delivery. Then contract compliance, spend under management, emergency purchase ratio. Smaller teams often start with four: spend under management, cost savings, cycle time, on-time delivery. Those cover money, speed, and reliability without the reporting infrastructure most teams don’t have yet.
What is the most important procurement KPI?
Spend under management is the most common answer, and there’s a real reason for it: it’s the denominator for almost everything else you report. A 12% savings figure means something completely different at 40% spend under management than at 85%. But the honest answer depends on maturity and audience. A team at 40% should treat it as the priority — it explains every other number on the dashboard. A team already at 85% has largely answered that question and should be watching supplier risk and savings realization instead. And a CFO asking this question usually means procurement ROI, not spend coverage.
Shivangi is a Senior Content Marketer specializing in B2B SaaS, procurement, and enterprise technology. She creates research-driven content that helps procurement leaders and business decision-makers navigate AI, digital transformation, sourcing, and spend management. Her work focuses on turning complex industry developments into clear, practical, and actionable insights.
Schedule a Demo
We’d love to hear from you. Please give us a call on +91 76666 82222.
Explore more from Procol
Discover expert tips, how-to guides, industry insights, and the latest procurement trends.
10 Best Procurement Software for Businesses of All Sizes
Looking for the best procurement software companies? Compare the top 10...

Younus Sideeq • August 10, 2026

Ultimate Guide to Japanese Reverse Auction in 2026
Japanese reverse auctions offer procurement teams a smarter way to drive...
Younus Sideeq • July 9, 2026

Reverse Dutch Auction: What It Is and How It Works
Procurement teams today are expected to reduce costs, shorten sourcing cycles,...
Younus Sideeq • July 9, 2026